
COMMUNITY PROFILE
WHO WE SERVE
Justice-involved youth in East, West, and Central Contra County where the conditions behind justice involvement are most concentrated.
THE COMMUNITY
57,5901
individuals ages 15–20 live in East County, West County, Concord and Martinez
1 in 4
East and West County residents live below TWICE
the poverty line
< 1 in 3
students in Antioch, Pittsburg and West Contra Costa Unified read at grade level (county: 52%)
71%
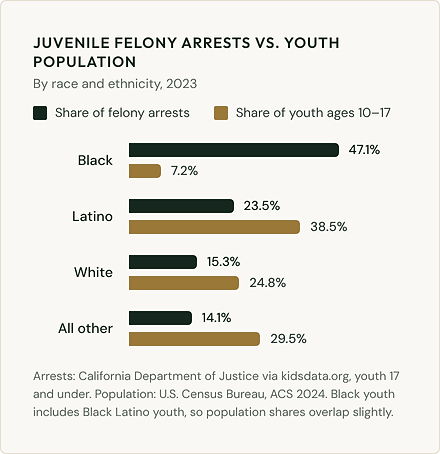
of county juvenile felony arrests are of Black and Latino youth
Our service area carries the county’s deepest poverty, its widest literacy gaps, and its highest rates of youth justice involvement
JUSTICE INVOLVEMENT
BLACK YOUTH: 7% OF THE COUNTY'S YOUTH, 47% OF ITS JUVENILE FELONY ARRESTS
Black and Latino youth together account for 71% of juvenile felony arrests in Contra Costa County. These figures describe how systems respond to individuals, not who they are.
The county's juvenile felony arrest rate was 2.9 per 1,000 youth ages 10–17 in 2023, below the state's 3.8 but up from 2.6 in 2020. Antioch, Richmond, Pittsburg and Concord police generate most youth referrals to probation.
FOR PROSPECTIVE FUNDING PARTNERS
Complete the form and we will send you the full community profile.
NOTES AND SOURCES
1. Radix serves individuals ages 14–20. The Census Bureau groups 14-year-olds with ages 10–14, so they cannot be counted separately. Youth counts on this page cover ages 15–20 and understate the number of individuals in Radix's age range.
2. Central reflects Concord and Martinez only. All Central County adds Walnut Creek, Pleasant Hill, Clayton, Lafayette, Moraga, Orinda, Danville, San Ramon and Alamo. Concord and Martinez residents are counted in both.
3. Poverty figures use the Census Bureau's official threshold: $31,812 a year for two adults and two children (2024). Program eligibility uses the HHS guideline, $33,000 for a family of four in 2026; CalFresh covers households up to twice that. The California Poverty Measure, adjusted for local cost of living, sets the Contra Costa line at $47,665 and puts county poverty at 14%.
4. Population, race, poverty, education, language and CalFresh figures are sums of Census counts from the American Community Survey 2020–2024 5-year estimates, so each region adds up to the county total. No agency publishes juvenile arrests or probation caseloads by region of residence.
SOURCES
U.S. Census Bureau, American Community Survey 2020–2024 (via Census Reporter)
California Department of Education, CAASPP results 2024–25
California School Dashboard 2025
Prison Policy Initiative, Where People in Prison Come From: California 2020
kidsdata.org, juvenile felony arrests (California DOJ data)
RDA Consulting, Report on Juvenile Justice Programs and Services, 2021
U.S. Department of Health and Human Services, 2026 Poverty Guidelines